← Back to projects
Data Analytics 2023

Alumni Data Analysis

Data cleaning and exploratory analysis of a university alumni dataset — decoding enrichment-service demographic codes, joining fields, and analyzing giving-capacity indicators by major and geography. Originally my MBA capstone project.

This project was originally built as my MBA capstone at Louisiana Christian University, using real alumni records. That data is confidential and cannot be published (it includes personal information covered by FERPA and third-party data licensing agreements). The version shown here uses a randomly generated synthetic dataset built to match the exact structure and coding format of the original — same fields, same encoded values. The cleaning logic and analysis approach are identical to the original project; only the underlying data values are fake, so the specific numbers and charts below do not represent real people or a real institution.

The Problem

Universities receive alumni and prospect data from third-party enrichment services in a coded format — income, net worth, homeownership, and years-at-residence are represented as single letters rather than readable values. Before this data can be used for anything (fundraising segmentation, outreach targeting, reporting), it has to be decoded, cleaned, and joined with academic records (major, GPA, graduation year).

Approach

  1. Loaded the raw joined dataset (academic records + enrichment-service demographic codes).
  2. Built lookup dictionaries to decode each coded field (age brackets, income brackets, net worth brackets, home value, years-at-residence, homeownership status, marital status).
  3. Applied the decoding across the full dataset and exported a cleaned version.
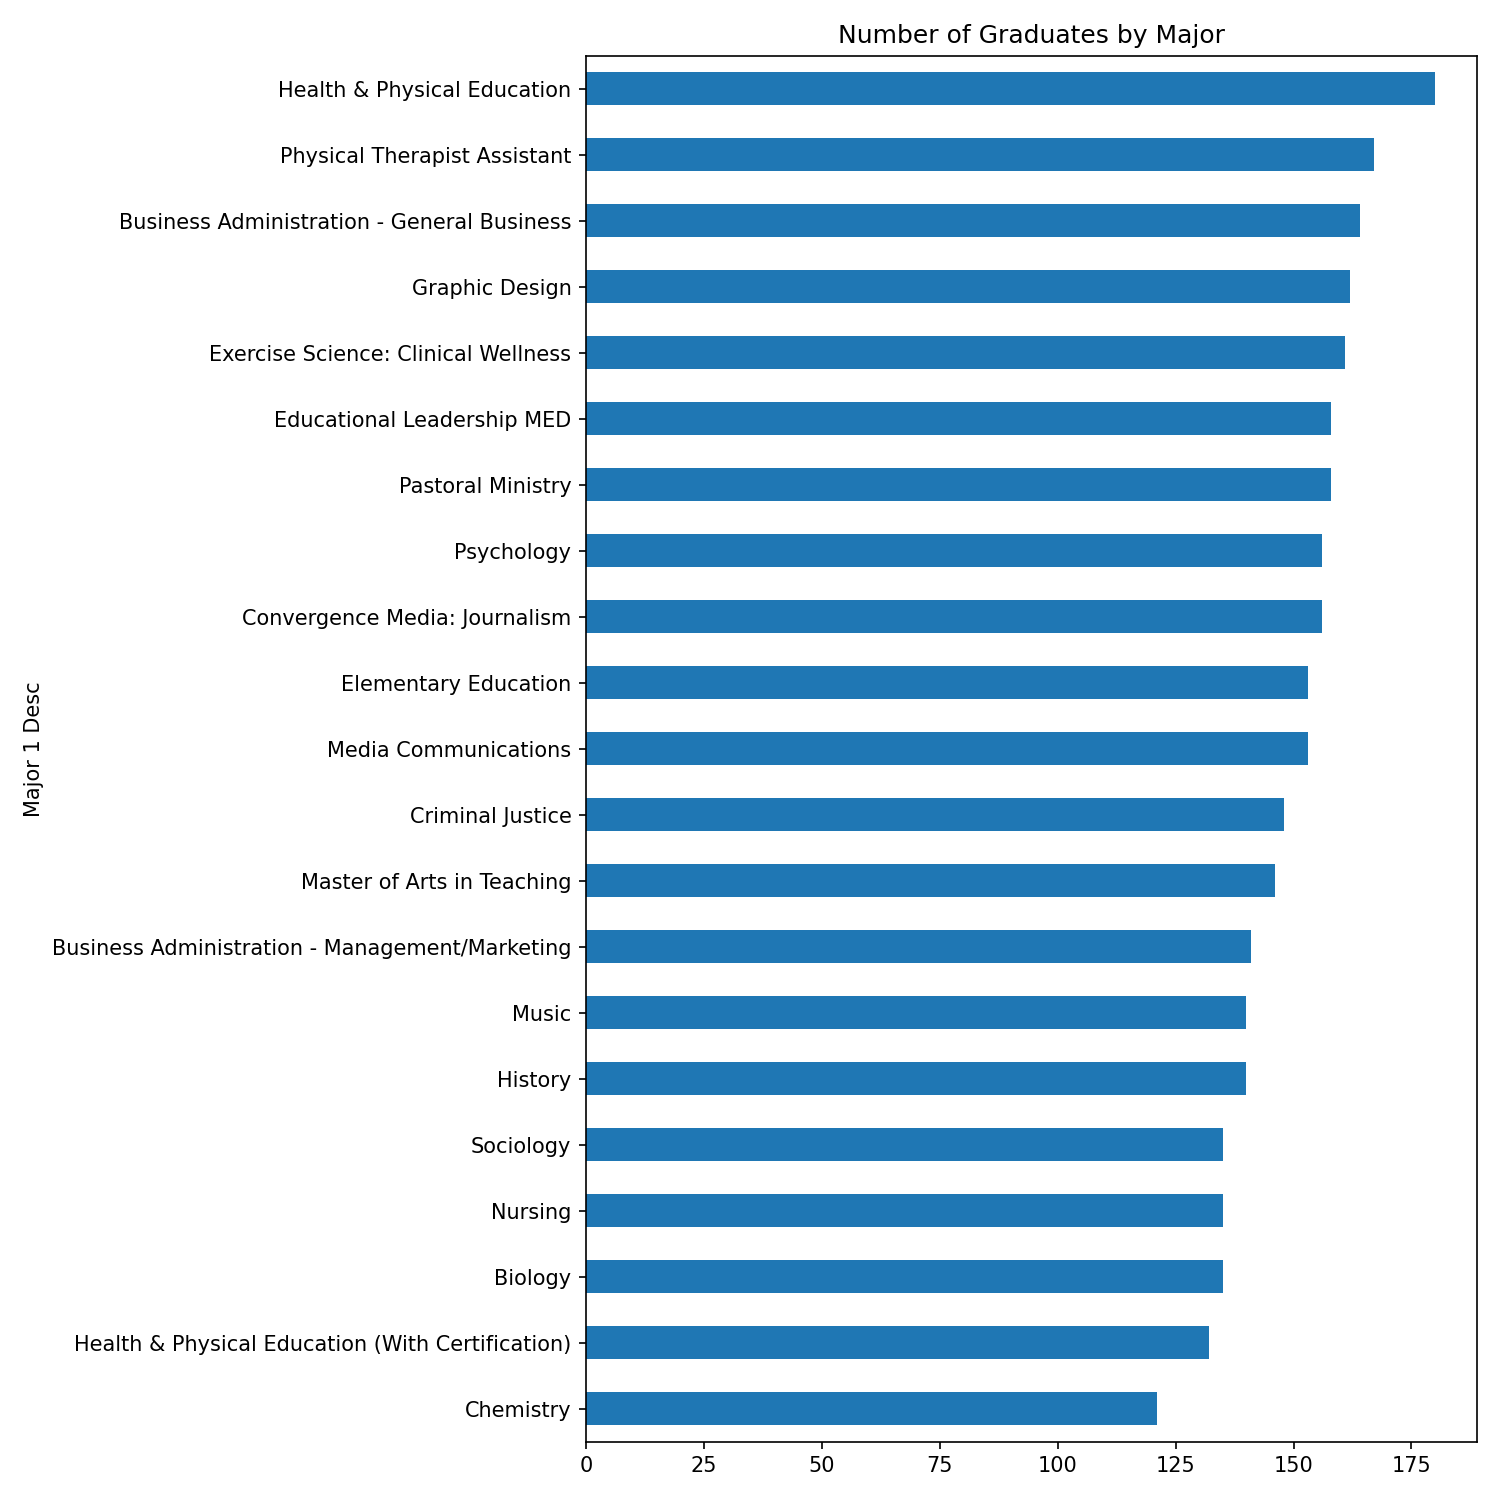
  4. Analyzed graduate counts by major.
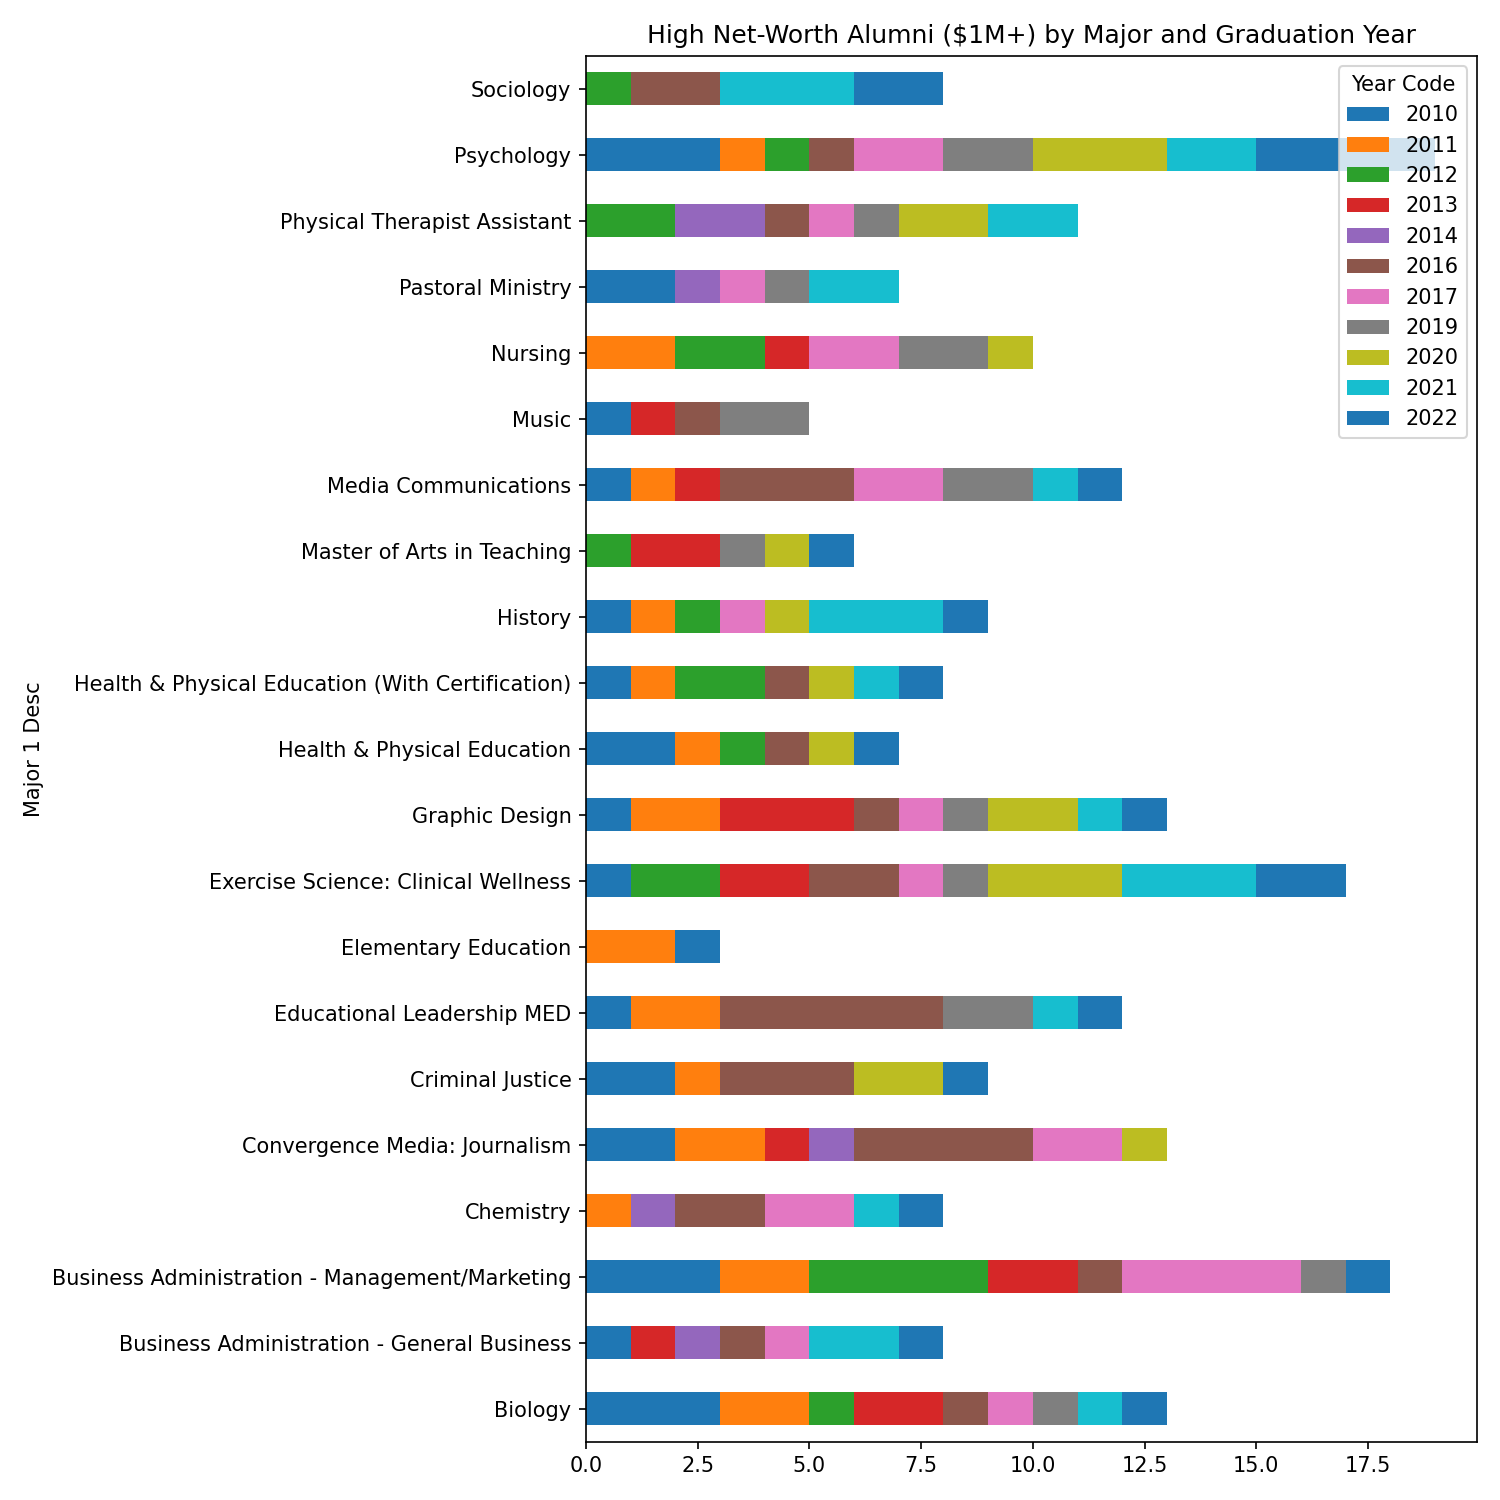
  5. Cross-referenced net worth against major and graduation year to identify which academic programs produce the highest concentration of high-net-worth alumni.
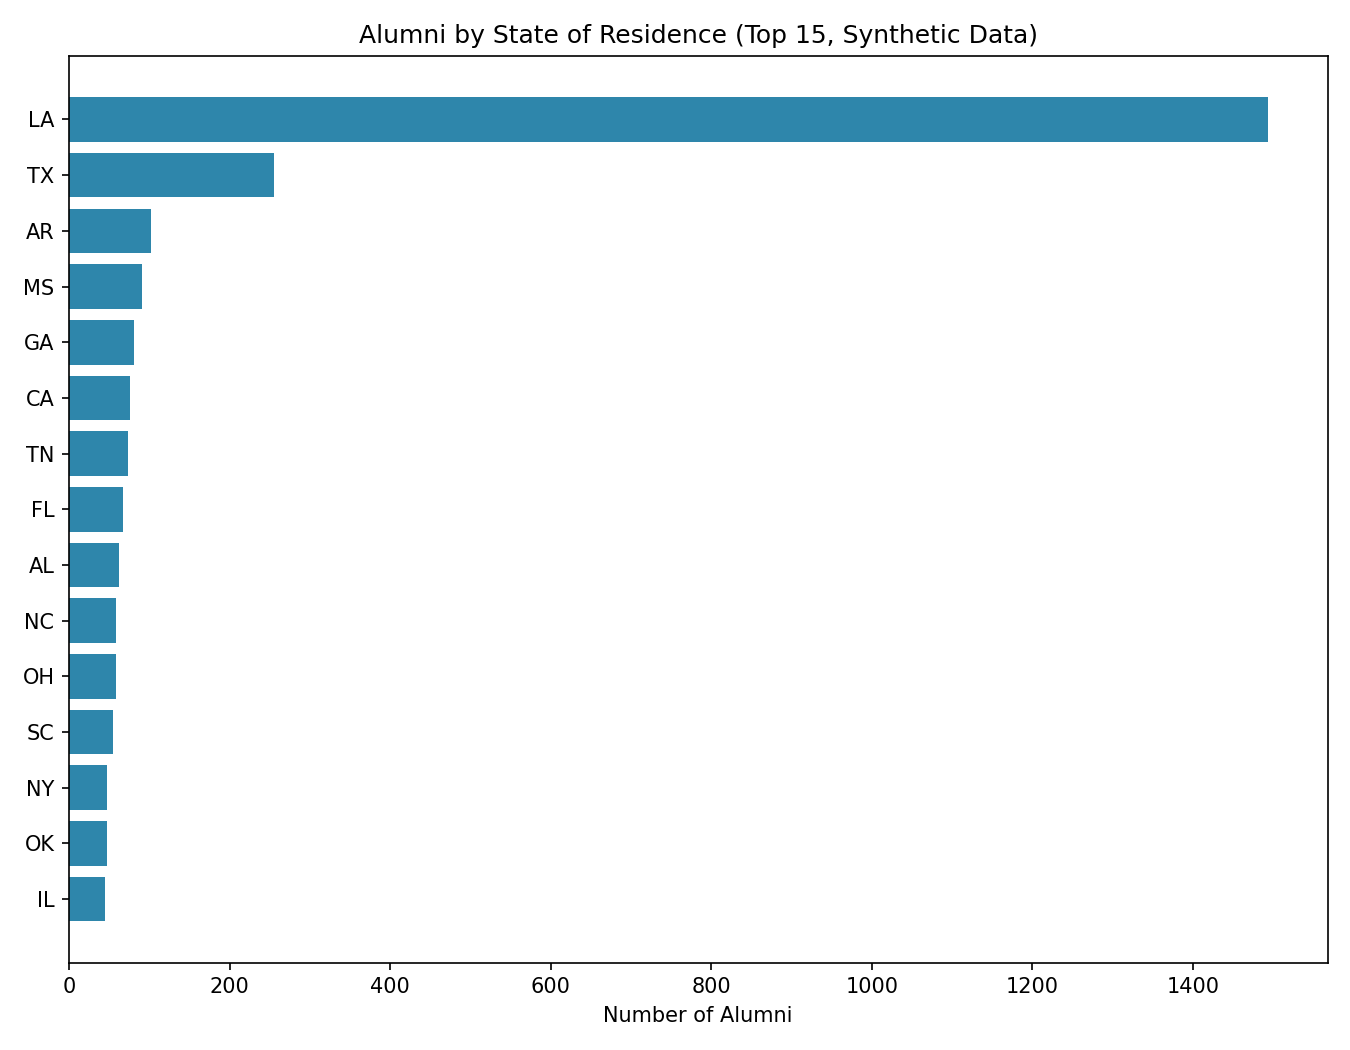
  6. Aggregated alumni counts by state to understand geographic distribution.

Results

Graduate counts by major, showing program size distribution across the dataset:
Graduates by major bar chart

High net-worth alumni ($1M+) by major and graduation year, surfacing which programs have historically produced the highest concentration of high-net-worth graduates — useful for fundraising and development prioritization:
High net worth alumni by major and graduation year

Geographic distribution of alumni by state of residence (top 15):
Alumni by state bar chart

The original project also built this geographic view as an interactive Tableau dashboard.

Tools

PythonpandasmatplotlibExcelTableau
View full code on GitHub →